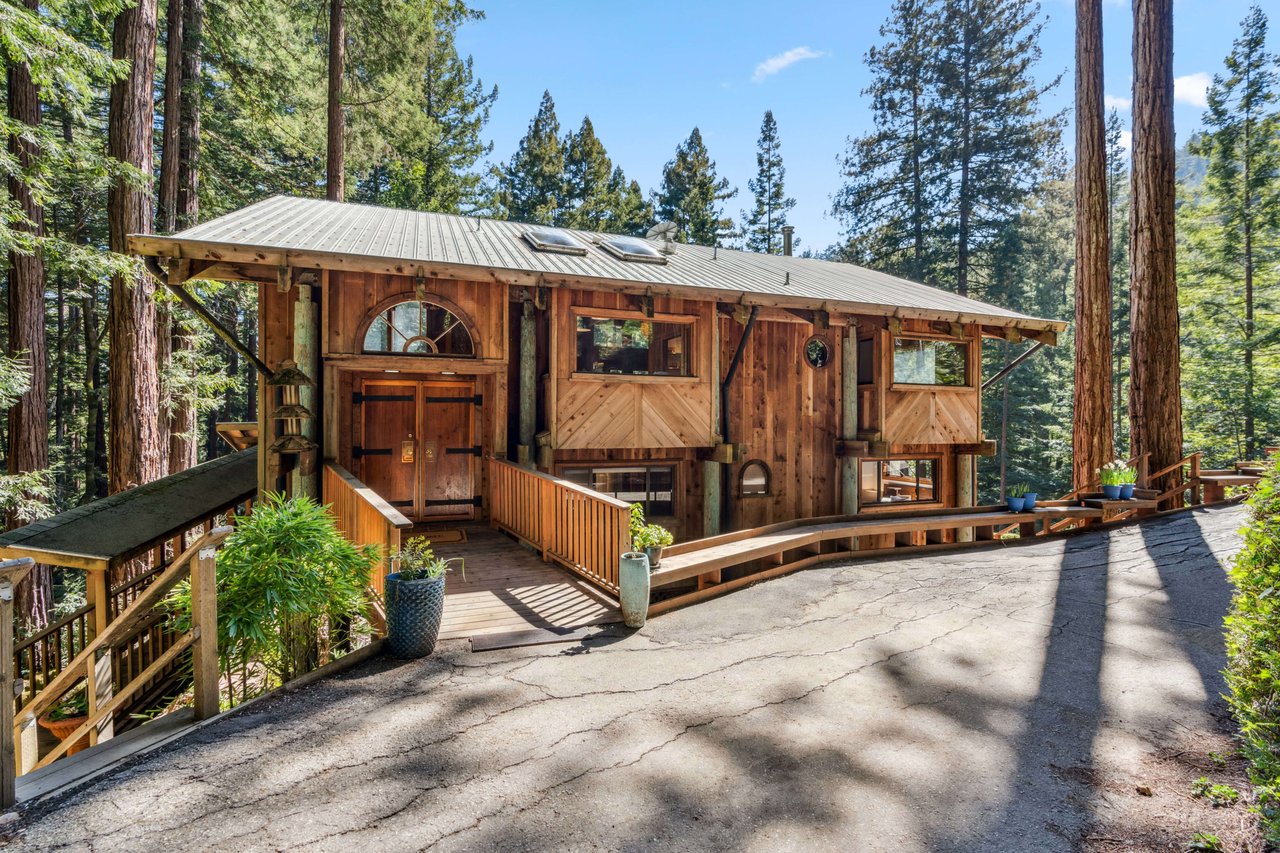
Would you believe me if I told you that buyer demand has been easing in the local housing market?
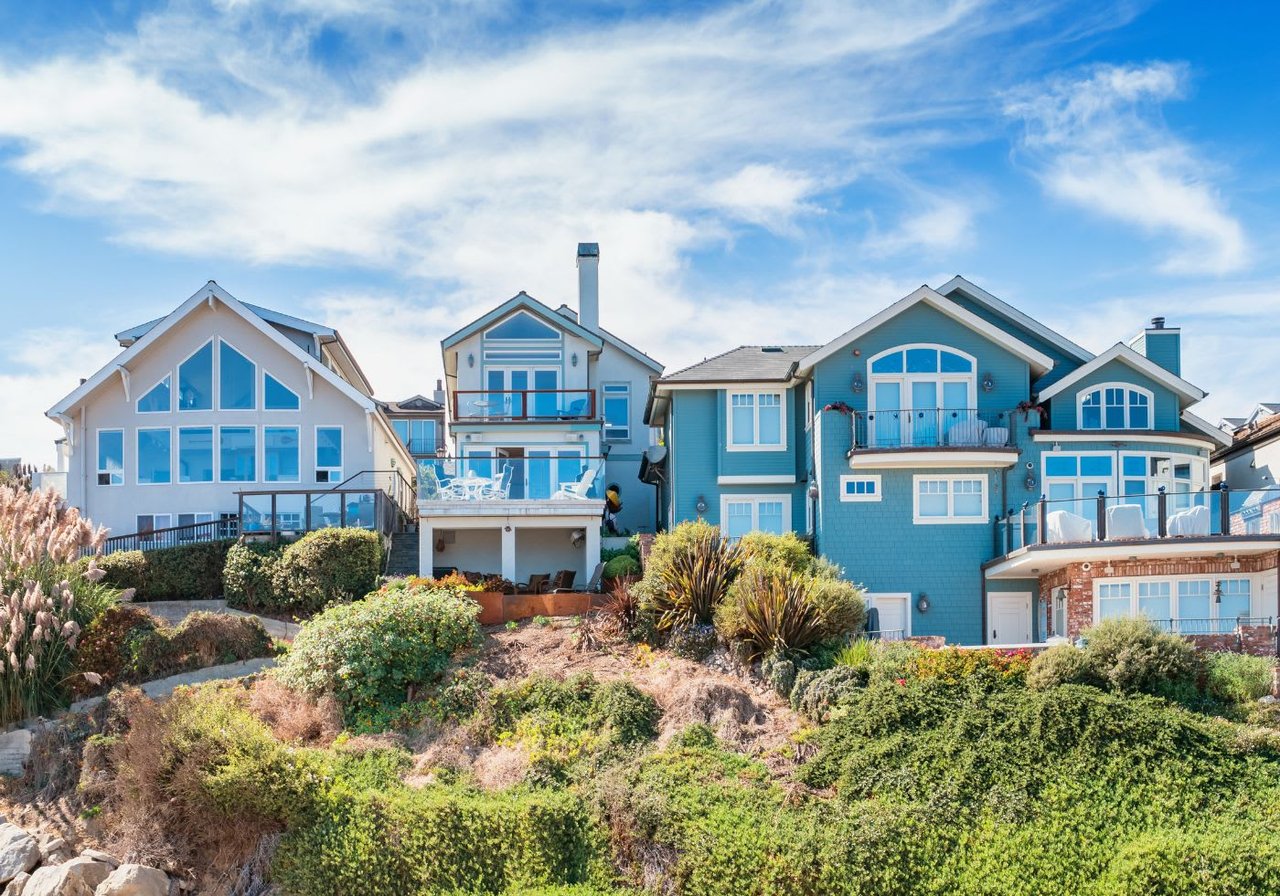
Sales are declining, and the number of listings is increasing in Santa Cruz County. But the homes that are selling are still, on average, selling quickly for well over asking: Median sales prices and year-over-year appreciation rates remain high. But, get this, median prices have declined two months in a row now.
When an overheated market cools, the change is typically gradual (absent a catastrophic event), and does not mean the market is weak by any normal standard. As an analogy, if traffic is going 100 miles per hour and drops to 65, it feels a lot slower, but cannot reasonably be described as slow. People will continue to have excellent personal and financial reasons to buy and sell homes.
As of late spring, less expensive home sales have been considerably impacted by rising interest rates. Sales of higher price homes have held up much better, but cooling demand is beginning to show up in pending-sale data. Affluent buyers tend to be more affected by financial markets, which became very volatile in May. Market changes are often uneven in the early months of a transition, with one home selling in days at well over list price, while next door, the seller has to reduce their price to get an offer. As markets cool, buyers become more discriminating; negative conditions previously ignored are noticed; more negotiation occurs; multiple offers and overbidding decline. Listings that are well prepared, show well, and priced right will have an increasing advantage.
Let’s Dig Into The Numbers
For those of us who like to look at data to understand what is happening in the world, let’s dive in to some of the numbers from May.
It is hard to believe that buyer demand is easing in the local housing market, but the numbers don’t lie:
-
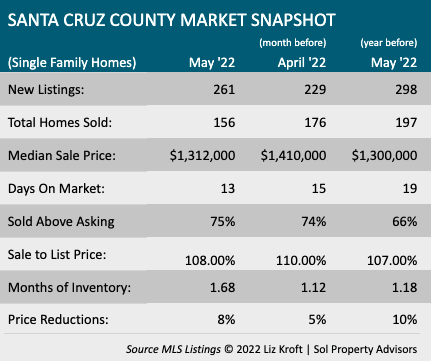
Listings Increase - New listings rose month-over-month and are trending upwards. The first quarter of the year listings inventory was 6% more than Q1 of 2021.
-
Median Price Drop - The median sales price for single family homes dropped for the second consecutive month with a decline of 12.5% March to April and 7.5% April to May.
- Pending Sales Decrease - Pending sales also decreased for the second month in a row. This is a sound indication of demand easing given that inventory rose.
-
Sale to List Price Declined - Homes sold closer to their asking price, on average 8% over asking in May compared to 10% in April.
-
Months of Inventory Rose - As of the first week in June there were 1.7 months of inventory available. This is the highest we have seen since May 2020 which topped out at 3.3 months.
While demand is cooling, other data points show that demand is still strong overall:
- Homes Selling Faster - Days on market has been on the decline since January with homes selling in 13 days on average.
- Selling Above Asking - 75% of homes sold above asking, a number that has been holding steady since March.
- Minimal Price Reductions - Price reductions increased slightly, but are still low by typical market standards with only 8% of homes reducing their price prior to selling.
What is causing the cooling market?
The driving force behind the Great Deceleration is the Federal Reserve. Over the pas six months, the average 30-year fixed mortgage rate has spiked from 3.11% to 5.09% as the Fed has moved into inflation-fighting mode. Of course, that not only prices out some would-be buyers, but also sees some borrowers - who must meet lenders’ strict debt-to-income ratios - lose their mortgage eligibility altogether.Housing inventory is still at a crisis level
The housing market is still incredibly unhealthy because of low inventory levels, not just locally, but all across the country. In order for us to return to a “normal” housing market the country needs 1.5 to 2 million housing units.
Entering the second half of the year the question remains: will mortgage rates continue to increase or will they fall again? If they fall again there is a worry that momentum of a normalizing market is lost.
What does this mean for you?
As with any market, it depends. Are you buying or are you selling? What type of property and in what neighborhood? What are your goals in the real estate market? What do your future plans and financial picture look like?
Let’s uncover what today’s market means for your housing goals. I’m always just a phone call or cup of coffee away whenever you would like to discuss your options and the best strategy for your future.